Clickhouse show slow query log
rank top slow query
1 | -- query SQL 维度的数据 |
normalized_query_hash SQL 语句的Hash编码,同一个SQL(不带参数)得到的编码是一样的,可以用该字段快速定位到是否位同一个SQL query_duration_ms SQL 执行的时间长度(单位ms)
展示及报表
由于system.query_log属于系统表,不便于BI展示,也未缩小数据查询规模,每隔1H统计一次,将数据写入到一个新表:
1 |
|
- 配置定时任务
1 | crontab -e |
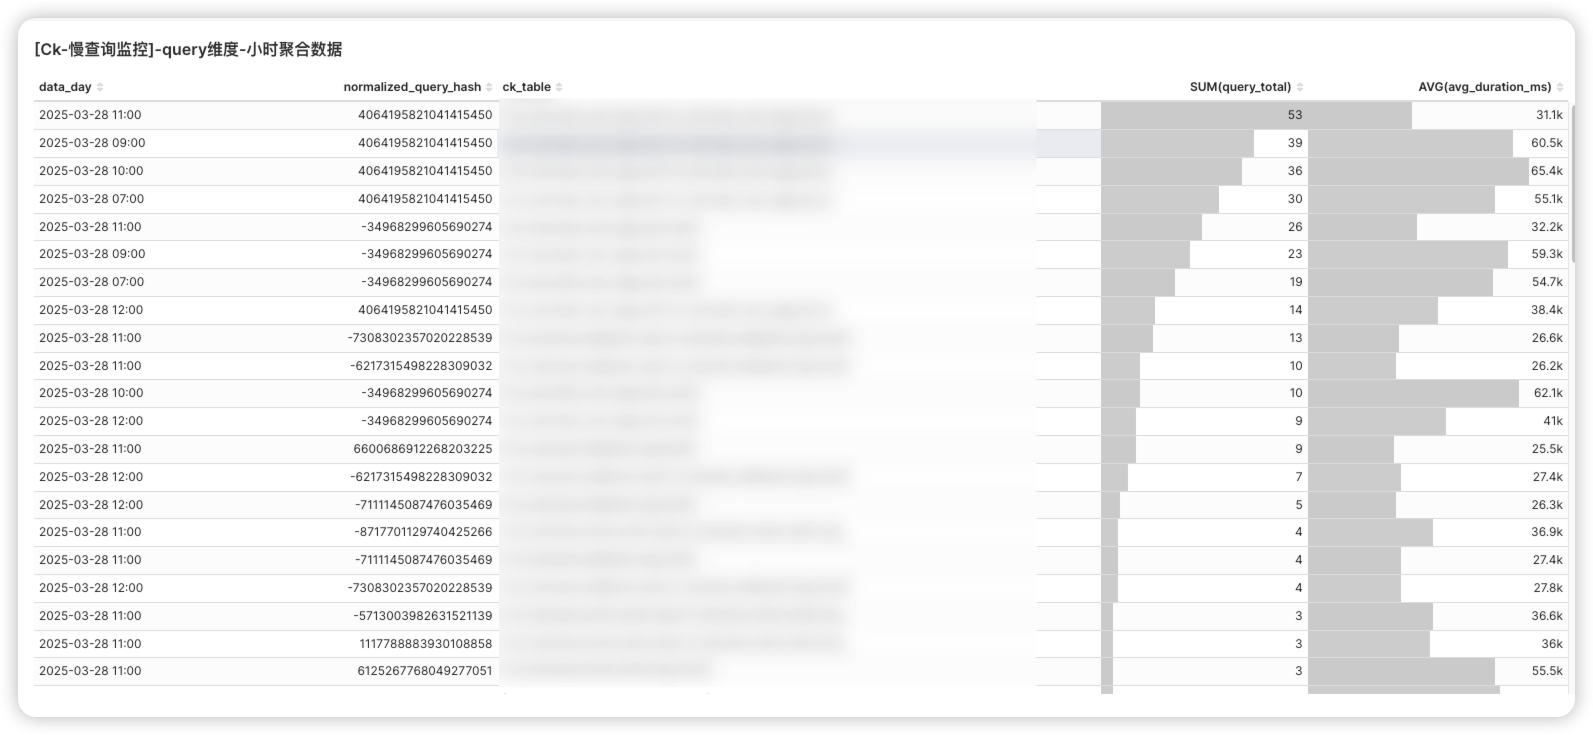
- 效果展示
- Title: Clickhouse show slow query log
- Author: Ordiy
- Created at : 2025-03-28 20:31:44
- Updated at : 2026-03-23 15:48:10
- Link: https://ordiy.github.io/posts/2024-12-01-clickhouse-optimize-show-slow-query-logs/
- License: This work is licensed under CC BY-NC-SA 4.0.
Comments