大数据运维监控系统(Big data operation and maintenance monitoring system)
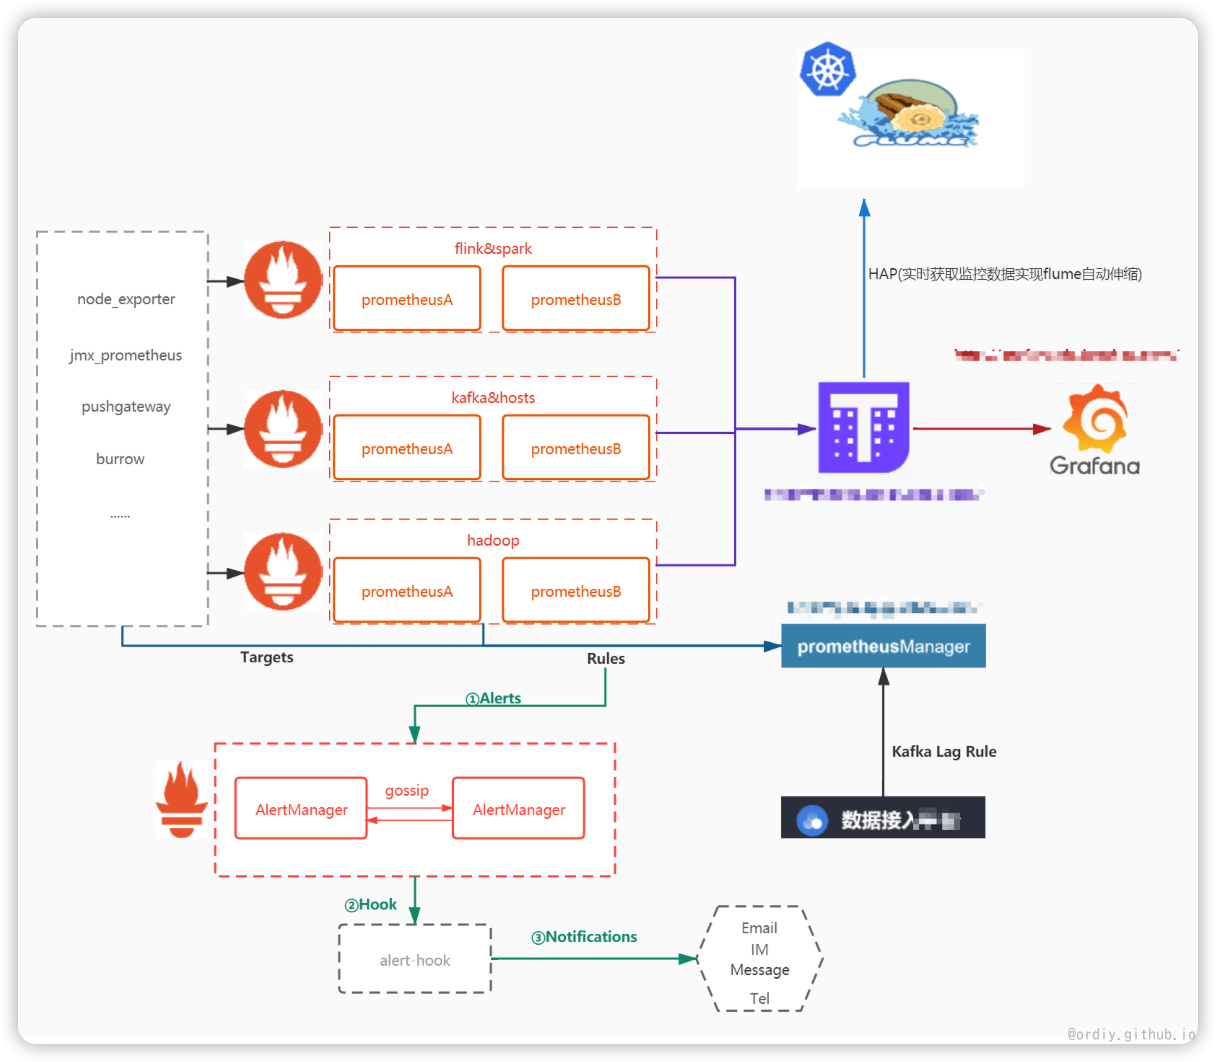
监控架构
- prometheus集群拆分、高可用架构搭建、配置规划
- prometheusManager平台开发(监控节点管理,告警规则配置,支持api外部调用)
- grafana可视化面板配置(主机,核心组件面板配置)
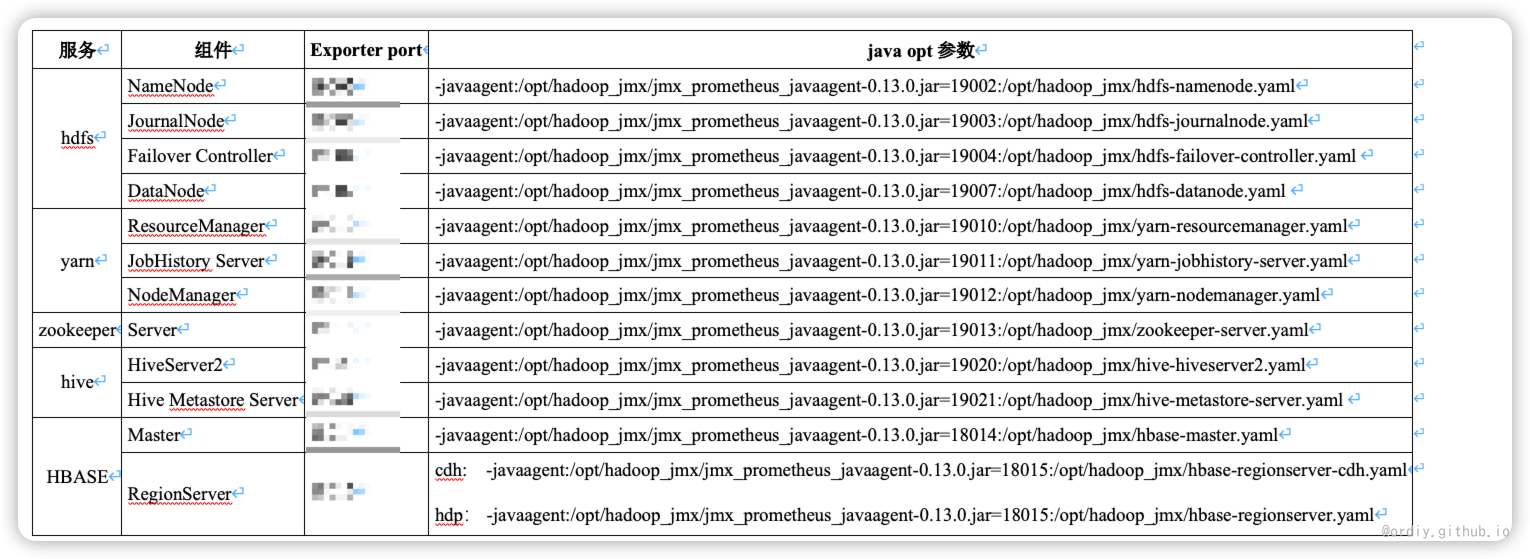
各大数据集群监控参数
- 核心指标分析抓取,过滤次要指标配置
- 端口配置评估
- jmx_exporter、prometheus_export版本测试调研
- 测试接入监控对集群的影响
部署和上线
- jmx_exporter可以 以java agent模式启动的,因此无须配置JMX远程输出相关的配置
- 集群所有节点分发jmx监控配置(节点信息已通过版本化管理) (ansible script + jar package)
- 集群角色配置监控参数
CDH cluster config jmx_prometheus

HDP cluster config jmx_prometheus
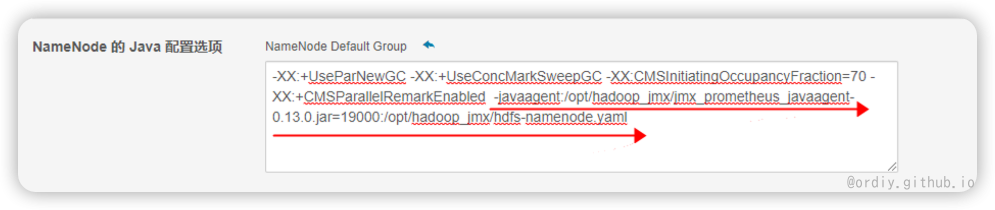
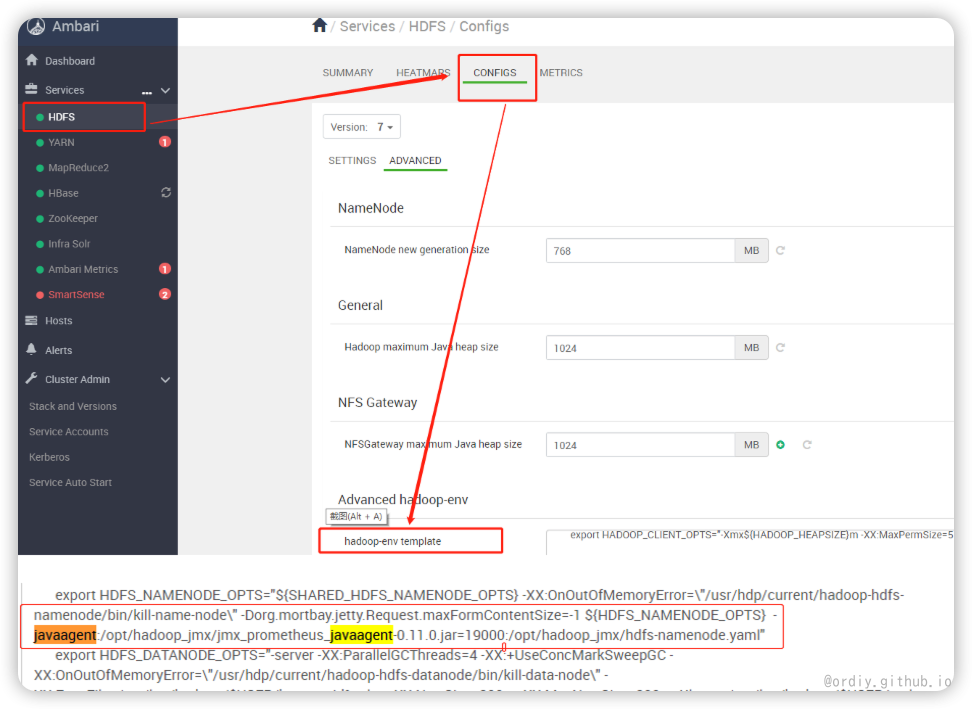
重启 根据集群的SOP操作指引,灰度重启各集群的各类服务节点。
组件重点监控指标
| 组件 | 指标 | 说明 | 是否需要告警 | 告警级别 warnning 警告major 严重 critical 灾难 | 告警阈值 | 持续时间(分钟) | 告警接收对象 | 备注 |
|---|---|---|---|---|---|---|---|---|
| kafka | Offline Brokers | 下线节点 | √ | major | ||||
| Offline Partitions | 下线分区 | √ | major | |||||
| kafka_log_log_value | topic数据量 | |||||||
| broker GC | 节点gc时长 | |||||||
| process_cpu_seconds_total | 进程cpu使用率 | |||||||
| jvm_memory_bytes_used | 进程jvm内存使用 | |||||||
| kafka_server_replicamanager_value | 节点分区数 | |||||||
| kafka_server_replicamanager_value | 节点leader 数 | |||||||
| kafka_server_brokertopicmetrics_oneminuterate | 集群数据生产/消费速率 | |||||||
| 节点数据生产/消费速率 | ||||||||
| topic数据生产/消费速率 | ||||||||
| topic消息生产速率 | ||||||||
| topic消息大小 | √ | warnning | ||||||
| kafka_server_zookeeperclientmetrics_count | 请求zk延时 | |||||||
| kafka_burrow_partition_lag | 消费lag | √ | dip接口业务方自行配置 | |||||
| memory | 节点内存 | |||||||
| cpu | 节点cpu | |||||||
| disk | 磁盘容量 | |||||||
| 磁盘io | √ | major | ||||||
| error_log | 日志告警 | √ | warnning | |||||
| zookeeper | ||||||||
| status | 节点状态 | √ | major | |||||
| NumAliveConnections | 连接数 | |||||||
| AvgRequestLatency | 请求延时 | |||||||
| GC | gc时长 | |||||||
| hdfs | status | 节点进程 | √ | major | to standby or to null | 告警在状态转换时候 | ||
| safe model | 安全模式 | |||||||
| capacity | 集群磁盘容量 | |||||||
| corrupt_blocks | 损坏的块 | |||||||
| missing_blocks | 丢失的块 | |||||||
| under_replicated_blocks | 副本不足的块 | |||||||
| volume_failures_total | 失败的卷 | |||||||
| num_live_data_nodes | 可用的datanode数量 | |||||||
| num_dead_data_nodes | 死亡的datanode数量 | |||||||
| num_stale_data_nodes | 由于心跳延迟而标记为过期的datanode数量 | |||||||
| blocks_total | 已分配的块 | |||||||
| block_capacity | 最大可分配块 | |||||||
| files_total | 文件总数 | |||||||
| pending_replication_blocks | ||||||||
| pending_deletion_blocks | ||||||||
| under_replicated_blocks | ||||||||
| scheduled_replication_blocks | ||||||||
| excess_blocks | ||||||||
| syncs60s99thpercentilelatencymicros | ||||||||
| gc_time_millis | ||||||||
| num_open_connections | ||||||||
| rpc_queue_time_avg_time | √ | warnning | 10s | >10s 升级为 major | ||||
| rpc_processing_time_avg_time | √ | warnning | 5s | |||||
| threads_runnable | ||||||||
| threads_waiting | ||||||||
| block_received_and_deleted_ops | ||||||||
| block_received_and_deleted_avg_time | √ | warnning | 10s | >10s 升级为 major | ||||
| transactions_since_last_checkpoint | √ | warnning | 2百万 | >2百万事升级为 major | ||||
| yarn | ||||||||
| status | 节点状态 | |||||||
| numactivenms | 可用的NodeManager | |||||||
| numunhealthynms | ||||||||
| numlostnms | ||||||||
| availablevcores | ||||||||
| allocatedvcores | ||||||||
| availablemb | ||||||||
| allocatedmb | ||||||||
| - | 集群总cpu使用率 | |||||||
| - | 集群总内存使用率 | |||||||
| appsrunning | ||||||||
| appskilled | ||||||||
| appsfailed | ||||||||
| pendingcontainers | ||||||||
| hbase | status | 节点状态 | √ | critical | 2分钟 | |||
| ritCount | 异常 region 数 | √ | major | 5分钟 | ||||
| hlogFileCount | Hlog文件数 | |||||||
| hlogFileSize | Hlog大小 | |||||||
| storeFileCount | Storefile个数 | |||||||
| storeFileSize | Storefile大小 | |||||||
| flushQueueLength | flush队列 | √ | warning | >500 | 10分钟 | |||
| compactionQueueLength | Compaction队列 | √ | warning | >1000 | 10分钟 | |||
| splitQueueLength | split队列 | √ | warning | >100 | 10分钟 | |||
| blockCacheHitPercent | Blockcache命中率 | |||||||
| Mutate_num_ops | put次数 | |||||||
| ScanNext_num_ops | scan次数 | |||||||
| Get_num_ops | get次数 | |||||||
| slowGetCount | 慢get次数 | √ | major | >100 | 2分钟 | |||
| slowPutCount | 慢put次数 | √ | major | >1000 | 10分钟 | |||
| totalRequestCount | 请求总次数 | |||||||
| percentFilesLocal | 本地化率 | √ | major | <90% | 60分钟 | |||
| Get_99th_percentile | Get延迟 | √ | major | >5000ms | 2分钟 | |||
| Scan_99th_percentile | Scan延迟 | |||||||
| Mutate_99th_percentile | Put延迟 | √ | warning | >5000ms | 10分钟 | |||
| FlushTime_99th_percentile | flush花费时间 | |||||||
| SplitTime_99th_percentile | split花费时间 | |||||||
| numOpenConnections | 连接数 | |||||||
| TotalCallTime_99th_percentile | 响应时间 | √ | major | >5000 ms | 2分钟 | |||
| ProcessCallTime_99th_percentile | 处理时间 | √ | major | >5000 ms | 2分钟 | |||
| MemHeapMaxM | 最大内存 | |||||||
| MemHeapUsedM | 已使用内存 | √ | major | >80% | 5分钟 | |||
| ThreadsRunnable | 运行线程数 | |||||||
| GcCount | GC次数 | |||||||
| GcTimeMillis | 时长 | |||||||
| flume | flume_source_metrics_EventAcceptedCount | |||||||
| flume_channel_metrics_ChannelSize | ||||||||
| flume_source_metrics_EventReceivedCount | ||||||||
| spark | ||||||||
| jvm_memory_usage | jvm内存使用情况 | |||||||
| jvm_gcTime_count | jvm垃圾回收次数 | |||||||
| filesystem_usage | hdfs文件读写速率 | |||||||
| jvm_memory_pools | jvm内存池使用情况 | |||||||
| executor_tasks | executor完成task的个数 | |||||||
| flink | ||||||||
| flink_jobmanager_job_fullRestarts | job重启次数 | |||||||
| flink_taskmanager_job_task_operator_KafkaConsumer_records_consumed_rate | kafka消费速率 | |||||||
| flink_jobmanager_Status_JVM_Memory_Direct_Count | The number of buffers in the direct buffer pool. | |||||||
| flink_jobmanager_Status_JVM_Memory_Direct_TotalCapacity | The total capacity of all buffers in the direct buffer pool (in bytes). | |||||||
| flink_taskmanager_Status_JVM_Memory_Direct_Count | The number of buffers in the direct buffer pool. | |||||||
| flink_taskmanager_Status_JVM_Memory_Direct_TotalCapacity | The total capacity of all buffers in the direct buffer pool (in bytes). | |||||||
| flink_jobmanager_Status_JVM_Memory_Heap_Used | The amount of heap memory currently used (in bytes). | |||||||
| flink_jobmanager_Status_JVM_Memory_Heap_Max | The maximum amount of heap memory that can be used for memory management (in bytes). | |||||||
| This value might not be necessarily equal to the maximum value specified through -Xmx or the equivalent Flink configuration parameter. Some GC algorithms allocate heap memory that won't be available to the user code and, therefore, not being exposed through the heap metrics. | ||||||||
| flink_taskmanager_Status_JVM_Memory_Heap_Used | The amount of heap memory currently used (in bytes). | |||||||
| flink_taskmanager_Status_JVM_Memory_Heap_Max | The maximum amount of heap memory that can be used for memory management (in bytes). | |||||||
| This value might not be necessarily equal to the maximum value specified through -Xmx or the equivalent Flink configuration parameter. Some GC algorithms allocate heap memory that won't be available to the user code and, therefore, not being exposed through the heap metrics. | ||||||||
| flink_jobmanager_Status_JVM_CPU_Load | The recent CPU usage of the JVM. | |||||||
| flink_taskmanager_Status_JVM_CPU_Load | The recent CPU usage of the JVM. | |||||||
| flink_jobmanager_job_numberOfCompletedCheckpoints | job中完成的chk数量 | |||||||
| flink_jobmanager_job_numberOfInProgressCheckpoints | job中进行中的chk数量 | |||||||
| flink_jobmanager_job_lastCheckpointSize | job中最后一个chk大小 | |||||||
| flink_jobmanager_job_lastCheckpointDuration | job中最后一个chk耗时 | |||||||
| azkaban | ||||||||
| excutors status |
告警配置
告警的核心是告警分析
- 告警平台: 通过使用操作员预先设置好的告警过滤规则,将各个系统传过来的告警进行规则压制-->再将过滤后的告警再分层级压制→展示、处理、分发通知 告警压制: 1、过滤无用告警(如系统变更操作等非物理故障造成的告警) 2、过滤次要告警(例如告警等级较低或者风向很小的告警) 3、根据规则过滤主要告警 4、被过滤的告警触发的通知消息被系统压制在消息队列中 5、等下次事件再触发或者新的调度方案生成后才发出通知消息 6、过滤后剩下的告警,会即时通过短信、邮件、im、工单等形式通知相关的操作人员处理告警故障 告警分析: 1、将采集到告警按照定制的时间间隔进行汇总、统计、分析 2、将分析的结果总结成案例,做成样本提供预测告警 告警处理及推送: 1、对过滤剩下的告警信息进行分类,重新组装信息,压缩打包,提取摘要等,将告警信息推送 2、调用各通道接口,对告警信息进行分批发送 故障预测技术: 1、基于历史数据的预测 2、基于状态监控的预测
- Title: 大数据运维监控系统(Big data operation and maintenance monitoring system)
- Author: Ordiy
- Created at : 2023-02-02 00:00:00
- Updated at : 2026-03-23 15:48:10
- Link: https://ordiy.github.io/posts/2023-02-02-big-data-maintenance-system/
- License: This work is licensed under CC BY-NC-SA 4.0.
Comments