Python 使用绘制统计图
简介
Matplotlib is a comprehensive library for creating static, animated, and interactive visualizations in Python.
Matplotlib是常用的数据可视化工具之一(灵活、功能强大)
安装包:
1 | #url 国内下载速度较慢 可以使用proxychain + 梯 |
python 绘图统计
折线图
1 | #python3 |
python 拟合
1 | #python3 |
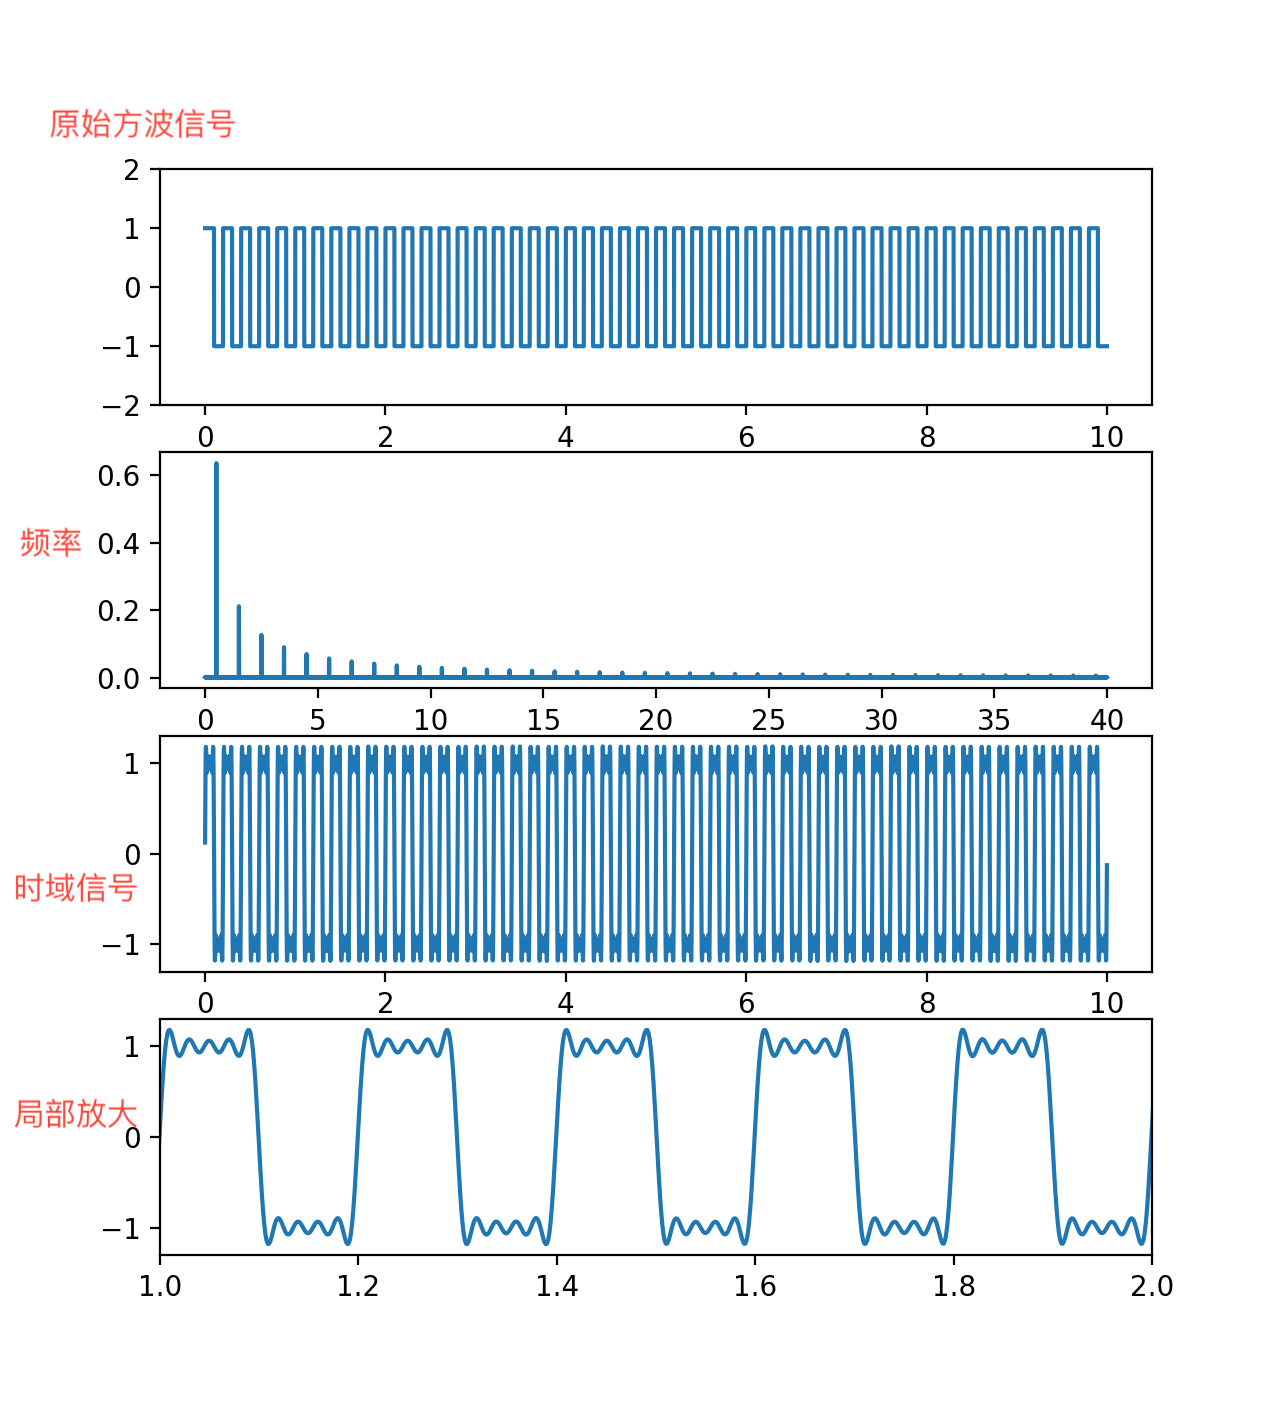
傅立叶变换
1 | #python3 |
绘图效果
参考
- Title: Python 使用绘制统计图
- Author: Ordiy
- Created at : 2019-11-14 15:29:51
- Updated at : 2026-04-07 09:40:03
- Link: https://ordiy.github.io/posts/2020-05-python-count/
- License: This work is licensed under CC BY-NC-SA 4.0.
Comments