JVM jstat jcmd command
jstat 简介
jstat - Java Virtual Machine Statistics Monitoring Tool.The jstat utility uses the built-in instrumentation in the Java HotSpot VM to provide information about performance and resource consumption of running applications. Oracle docs
1 | show options |
jstat option list:
| Option | Displays... |
|---|---|
| class | Statistics on the behavior of the class loader. |
| compiler | Statistics of the behavior of the HotSpot Just-in-Time compiler. |
| gc | Statistics of the behavior of the garbage collected heap. |
| gccapacity | Statistics of the capacities of the generations and their corresponding spaces. |
| gccause | Summary of garbage collection statistics (same as -gcutil), with the cause of the last and current (if applicable) garbage collection events. |
| gcnew | Statistics of the behavior of the new generation. |
| gcnewcapacity | Statistics of the sizes of the new generations and its corresponding spaces. |
| gcold | Statistics of the behavior of the old and permanent generations. |
| gcoldcapacity | Statistics of the sizes of the old generation. |
| gcpermcapacity | Statistics of the sizes of the permanent generation. |
| gcutil | Summary of garbage collection statistics. |
| printcompilation | HotSpot compilation method statistics. |
jstat 常用命令
jstat gc
1 | #1s show |
output
1 | S0C S1C S0U S1U EC EU OC OU MC MU CCSC CCSU YGC YGCT FGC FGCT GCT |
| GC 指标 | info | Desc.. |
|---|---|---|
| S0C | Current survivor space 0 capacity (kB). | |
| S1C | Current survivor space 1 capacity (kB). | |
| S0U | Survivor space 0 utilization (kB). | |
| S1U | Survivor space 1 utilization (kB). | |
| EC | Current eden space capacity (kB). | |
| EU | Eden space utilization (kB). | |
| OC | Current old space capacity (kB). | |
| OU | Old space utilization (kB). | |
| MC | Metaspace capacity (kB). | |
| MU | Metacspace utilization (kB). | |
| CCSC | Compressed class space capacity (kB). | |
| CCSU | Compressed class space used (kB). | |
| YGC | Number of young generation garbage collection events. | |
| YGCT | Young generation garbage collection time. | |
| FGC | Number of full GC events. | |
| FGCT | Full garbage collection time. | |
| GCT | Total garbage collection time. |
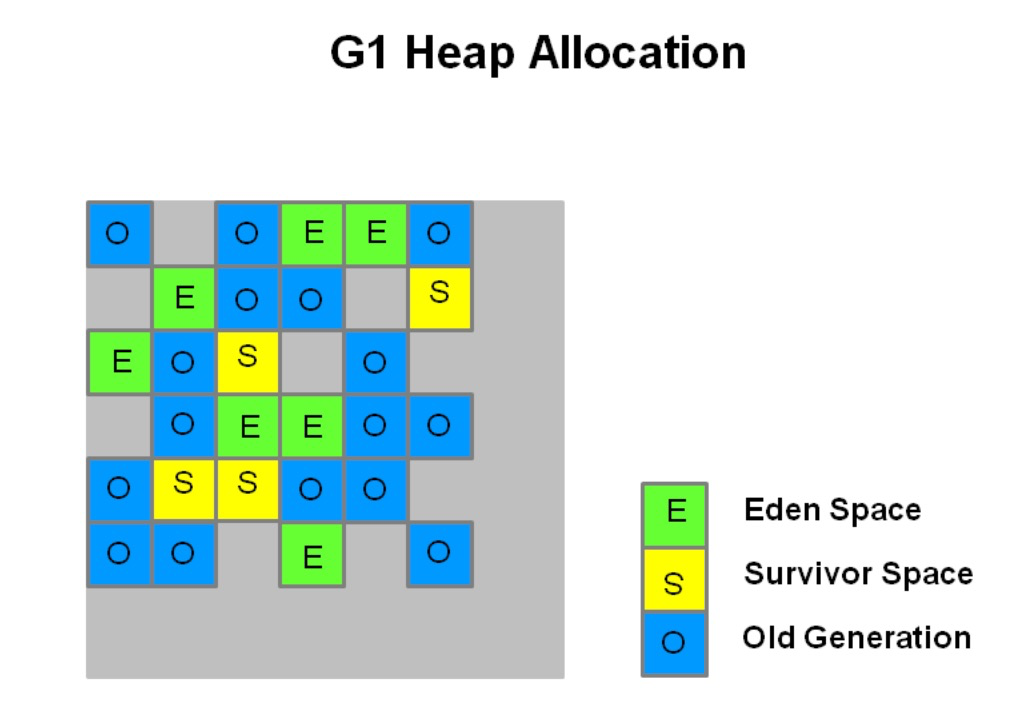
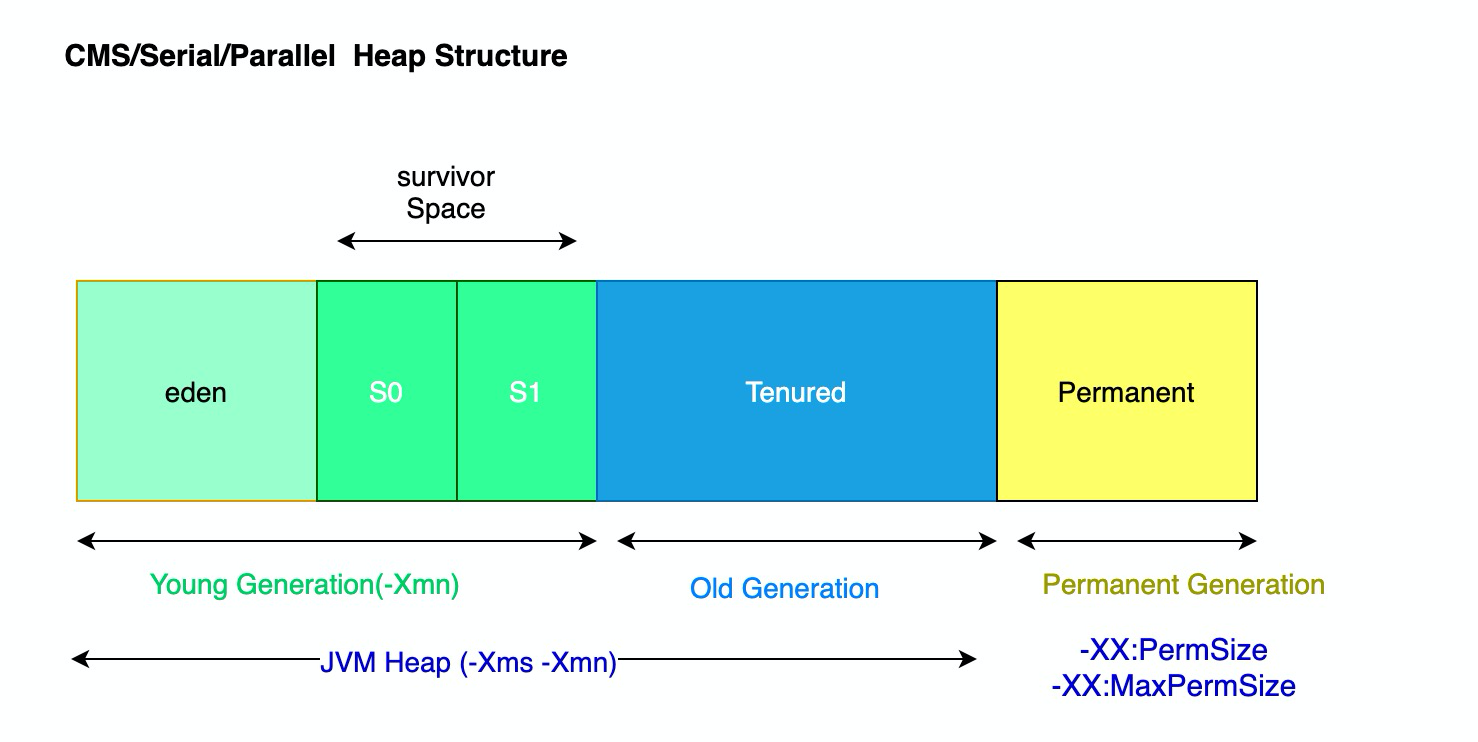
为便于理解输出的指标,先理解一下CMS/ G1GC Heap结构,简单介绍一下C1/CMS Heap Structure:
G1 Collector:
CMS/serial/parallel Collector:
jcmd
jcmd用于向JVM发送diagnostic command (JDK8及以上).
- heap dump dump 进程的heap.
1 | # jcmd 7891 GC.heap_dump filename=./7891_gc_dump.dump |
- VM classload java 进程启动的信息
1 | # java 进程启动信息 |
- Troubleshoot with jcmd Utility
使用jcmd启动、停止
Troubleshoot Tool.
1 | # 强制 对进程执行GC |
其它几个命令使用
参考
- Title: JVM jstat jcmd command
- Author: Ordiy
- Created at : 2019-01-01 00:00:11
- Updated at : 2026-03-23 15:48:10
- Link: https://ordiy.github.io/posts/2019-01-01-jvm-jstat/
- License: This work is licensed under CC BY-NC-SA 4.0.
Comments